Detect peaks
detectpeaks finds the peaks in a 1D, 2D or higher-dimensional spectrum and returns them as a Vector{Peak{N}}, strongest first. For an introduction, see the tutorial Peaks and peak lists.
using NMRTools, CairoMakie
spec = loadnmr(example("2d_hn_ubq"))
Thresholds
A peak is a local maximum whose height exceeds a threshold, by default ten times the noise level (spec[:noise]). Set the threshold relative to the noise with snr, or absolutely with threshold:
length(detectpeaks(spec)), length(detectpeaks(spec; snr=30))(115, 82)detectpeaks(spec; threshold=1e6) # an absolute thresholdPositive and negative peaks
By default both positive and negative peaks are found. Select one sign with sign:
pos = detectpeaks(spec; sign=:positive)
neg = detectpeaks(spec; sign=:negative)
length(pos), length(neg)
(106, 9)fig, ax, _ = nmrplot(spec; title="positive (black) and negative (red) peaks")
nmrplot!(ax, pos)
nmrplot!(ax, neg; color=:red)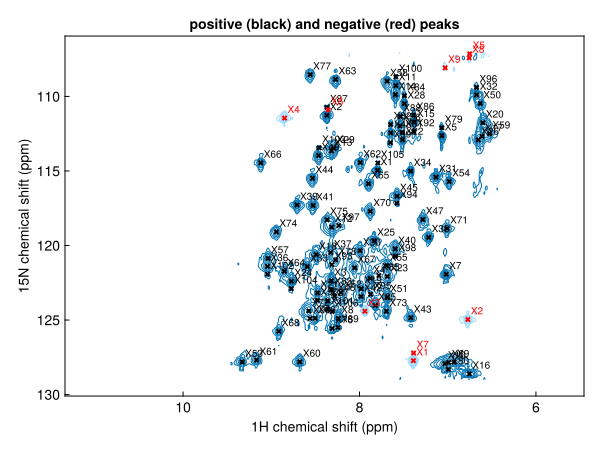
A region of the spectrum
Select a region before picking:
amides = detectpeaks(spec[7.5 .. 8.7, 116 .. 126]; sign=:positive)
fig, ax, _ = nmrplot(spec[7.5 .. 8.7, 116 .. 126])
nmrplot!(ax, amides)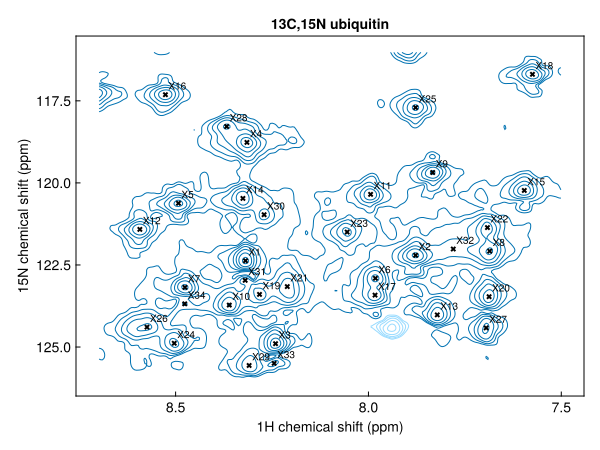
or filter the list afterwards by position:
filter(p -> 7.5 < ppm(p, 1) < 8.7, pks)1D and 3D spectra
The same function works in any number of dimensions:
detectpeaks(loadnmr(example("1d_19f_fragments")))33-element Vector{Peak{1}}:
label x (ppm) lwx (Hz) intensity
X1 -62.4028 10.5754 1.29487e10
X2 -61.9806 10.5591 1.05101e10
X3 -81.4543 10.2832 9.20486e9
X4 -73.5483 10.5481 8.62318e9
X5 -63.7302 10.4834 8.49229e9
X6 -62.5654 10.792 8.09777e9
X7 -116.097 10.7386 8.01604e9
X8 -186.403 17.487 7.8528e9
X9 -109.62 10.4566 6.58478e9
⋮
X25 -103.757 10.3508 4.31012e9
X26 -117.61 10.8091 4.29192e9
X27 -116.998 10.2847 4.19717e9
X28 -120.21 13.0039 4.19069e9
X29 -111.311 10.7964 4.09207e9
X30 -113.576 11.2534 3.9706e9
X31 -124.312 10.6301 3.6169e9
X32 -135.168 13.3065 2.9487e9
X33 -57.6887 11.1891 2.46745e9hnca = detectpeaks(loadnmr(example("3d_hnca_ubq")); snr=20, sign=:positive)
hnca[1:3]3-element Vector{Peak{3}}:
label x (ppm) y (ppm) z (ppm) lwx (Hz) lwy (Hz) lwz (Hz) intensity
X1 7.87406 115.062 43.3111 17.807 23.7113 17.3191 2.19147e6
X2 7.75171 109.212 42.6555 21.1198 24.9982 22.7863 891022.0
X3 7.61934 109.089 58.5038 19.6625 44.6236 17.2876 789423.0For a pseudo-2D series, pick peaks in one plane: detectpeaks(spec[:, 1]).
A single peak
findpeak finds the maximum nearest a given position, refined by interpolation, and labels it:
findpeak(spec, (8.27, 121.0); label="A28")Peak{2} A28
position (ppm): 8.27052, 120.968
linewidth (Hz): 26.302, 36.7464
intensity: 15999.2findnearest gives the index of the peak in a list nearest a position. scale weights the dimensions, since a ppm in ¹⁵N is not a ppm in ¹H:
i = findnearest(pos, (8.27, 121.0); scale=(1, 0.2))
pos[i]
Peak{2} X78
position (ppm): 8.27052, 120.968
linewidth (Hz): 26.302, 36.7464
intensity: 15999.2Filtering by properties
A peak list is a vector, so filter and sort with the accessors intensity, linewidth, ppm and label select peaks:
strong = filter(p -> intensity(p) > 50 * spec[:noise], pos)
narrow = filter(p -> linewidth(p, 1) < 30, pos)
length(strong), length(narrow)
(64, 90)In a pipeline
pks = loadfid("hsqc/1") |> autoprocess |> detectpeaks(snr=20)