Simple 2D Fitting
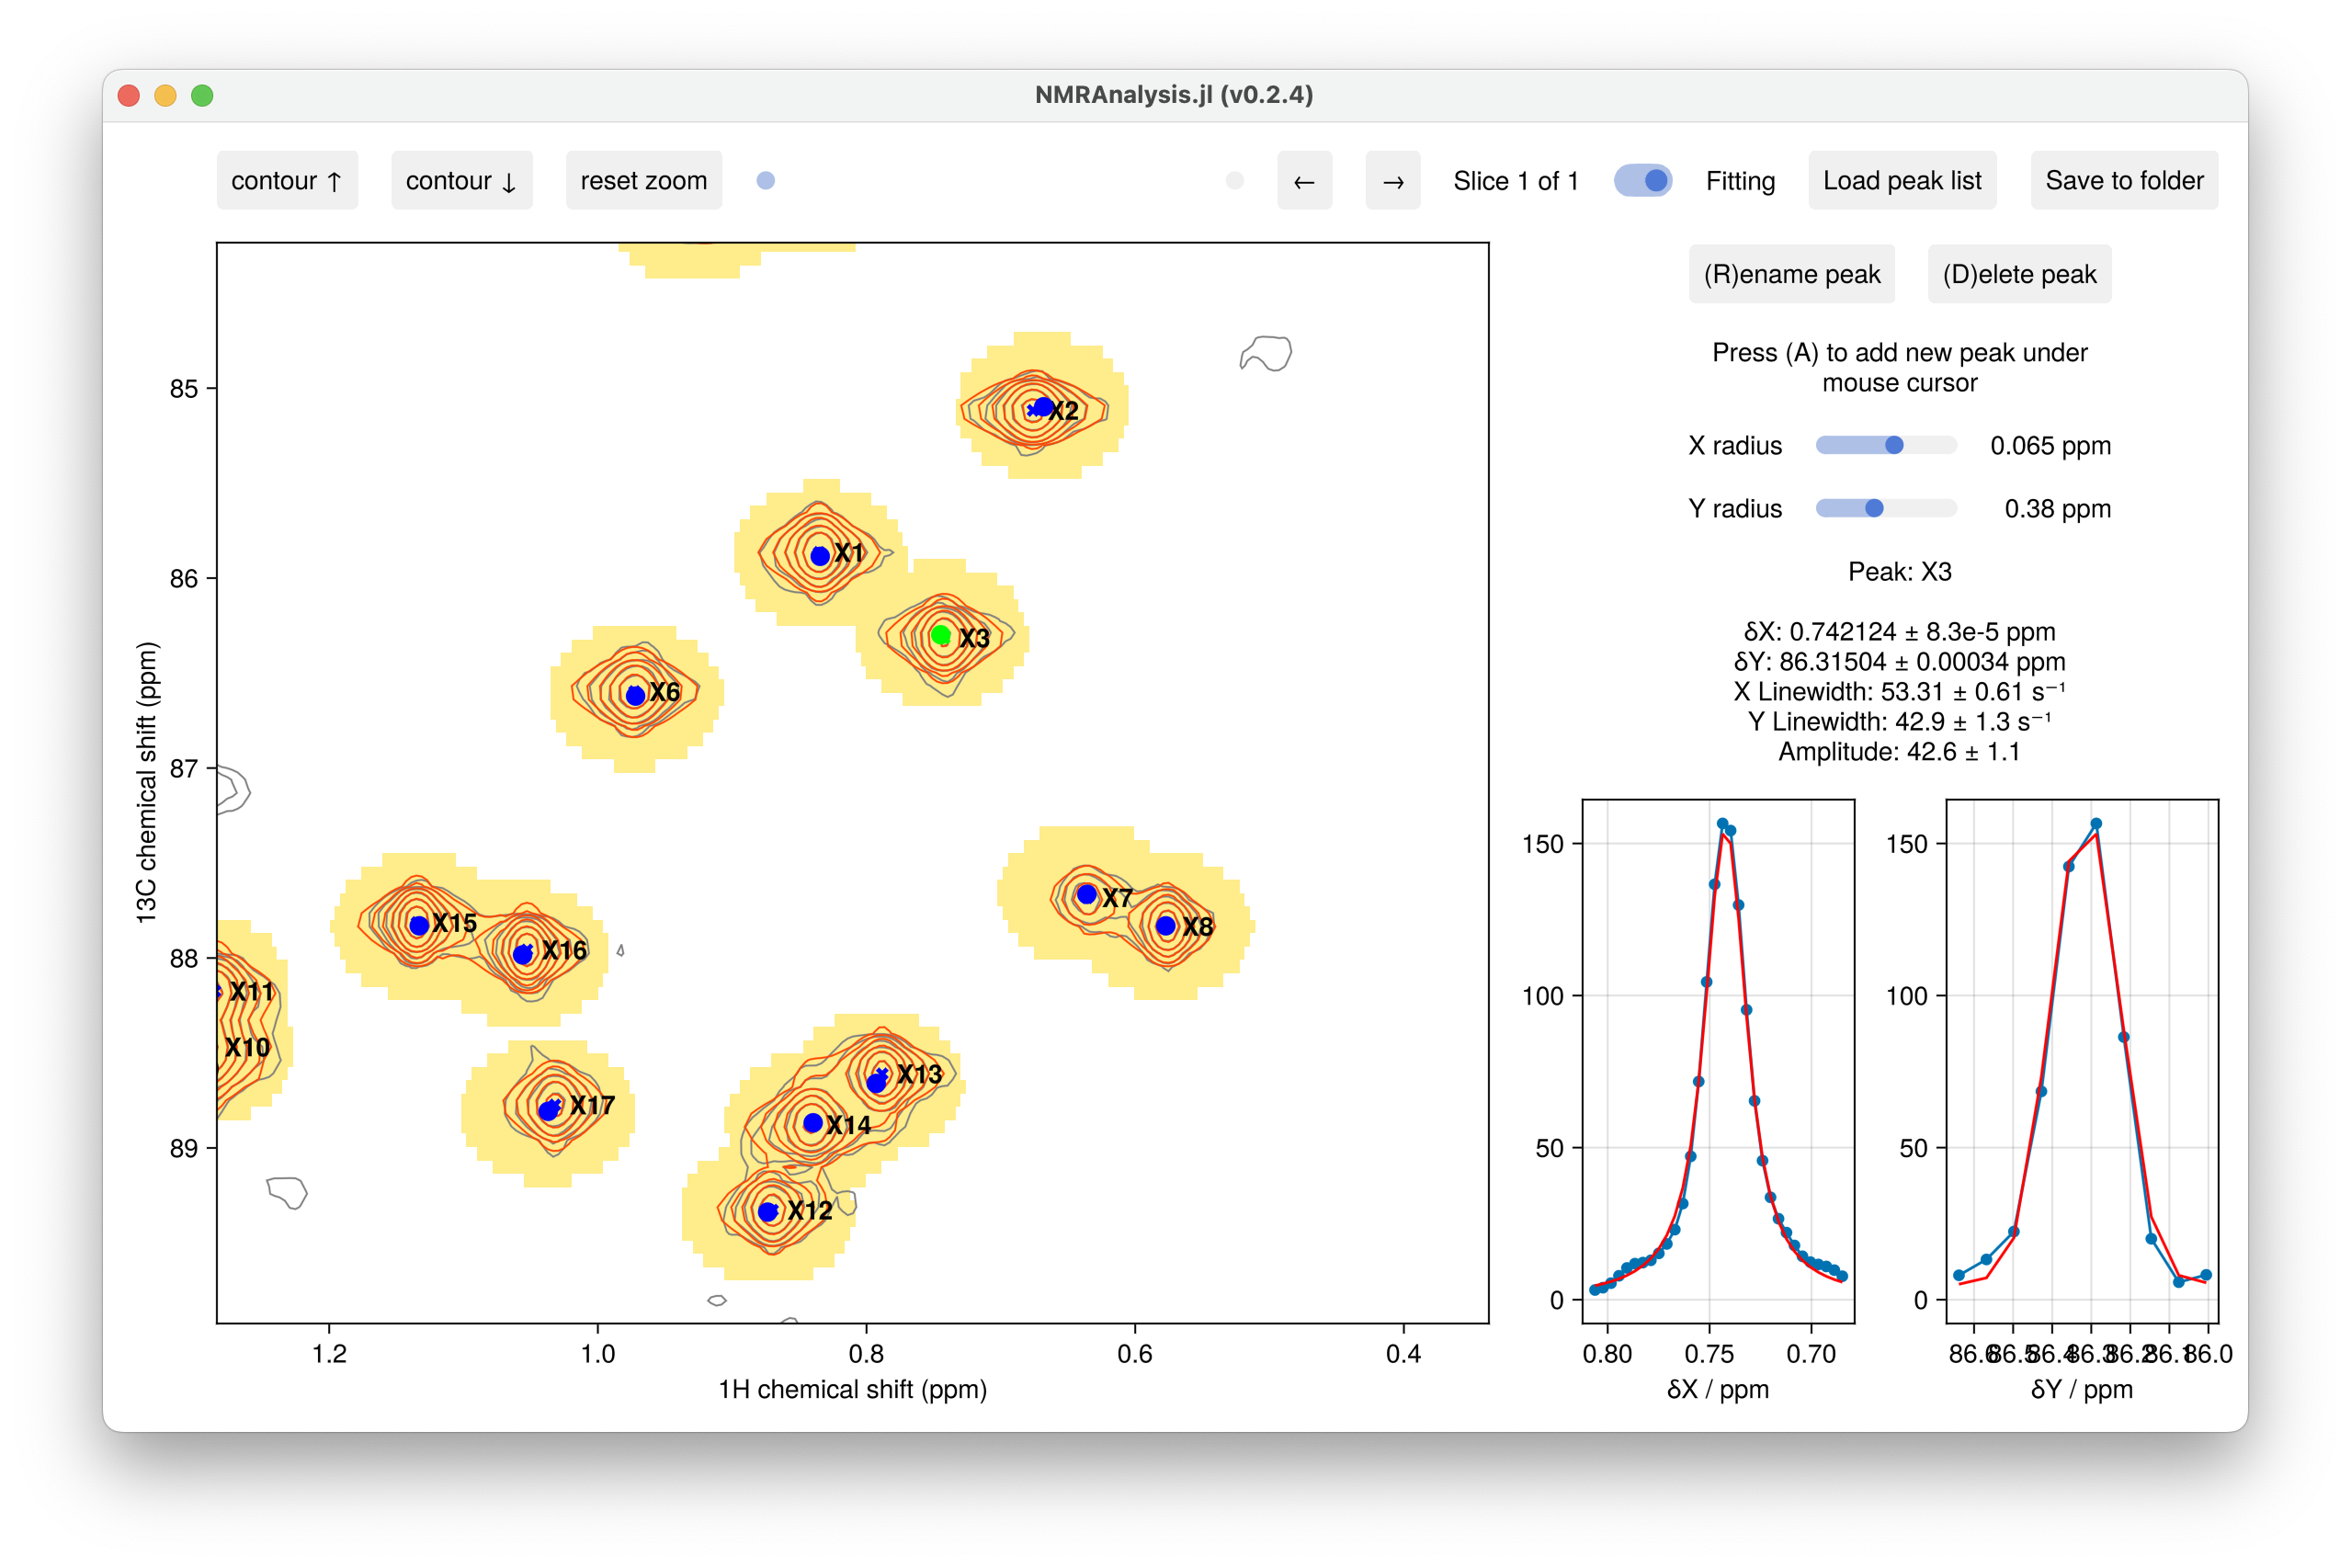
The fit2d function opens an interactive GUI for fitting peaks in a single 2D spectrum or a series of 2D spectra. Each peak is fitted to a 2D Lorentzian lineshape convolved with the window function applied during processing (as recorded in the spectrum metadata); no physical model is applied to the amplitudes across spectra — all measured quantities (peak positions, linewidths, and amplitudes) are reported directly.
Spectra are automatically normalised by the number of scans (ns) recorded for each experiment, so peak amplitudes are comparable across planes that may have been acquired with different numbers of scans.
Overlapping peaks — those whose fitting regions (controlled by the X and Y radius sliders) overlap — are detected automatically and fitted simultaneously as a group, so that the lineshapes of neighbouring resonances are properly accounted for.
This makes fit2d a flexible starting point for many different experiments. Typical use cases include:
- Single spectrum: measure chemical shifts and linewidths, or build a peak list for use with other analysis functions
- Intensity series: compare peak amplitudes across a concentration titration, temperature series, or time course without assuming a model
For data that follow a known physical model, consider the more specific functions: relaxation2d (exponential decay), recovery2d (magnetisation recovery), or modelfit2d (arbitrary equation).
Usage
using NMRAnalysis

# Single spectrum
fit2d("expno")

# Series of spectra — track peaks across multiple experiments
fit2d([
    "expno1",
    "expno2",
    "expno3",
])
Output
Clicking Save to folder writes one row per peak to results.csv — labels, residue/atom information, fitted chemical shifts (x, y), linewidths (R2x, R2y) and per-plane amplitudes (amp[1], amp[2], …), each with an uncertainty column. For a single-spectrum analysis there is one amplitude column; for a series there is one per spectrum.
See Peak Lists and Output Files for the full format, the recommended labelling conventions, and how to reload a file as input. Use summaryplot to plot amplitudes or linewidths against residue number.